Google announced in 2020 the Core Web Vitals, a series of factors that according to Google, would begin to be counted within the positioning algorithm that Google has from May 2021, thus affecting the positioning of the websites.
In the following article, we will find out what Core Web Vitals are, how they affect positioning, how to improve them and how they are managed with the most important CMSs on the market.
What are Core Web Vitals?
In short, we could say that they are three metrics focused on user experience. These metrics are oriented to measure the loading speed of the website, interactivity and the visual stability of the website.
These metrics, along with other factors such as pop-up removal, security and mobile optimisation, form the signals that Google uses to evaluate user experience.
The aim of these three metrics is for Google to detect what the user’s first impression will be when viewing the page. According to Google, websites that comply with these benchmarks focused on obtaining a better impression for the user are 24% less likely to lose users during the web loading process.
We will now explain the characteristics of the metrics that make up the Core Web Vitals:
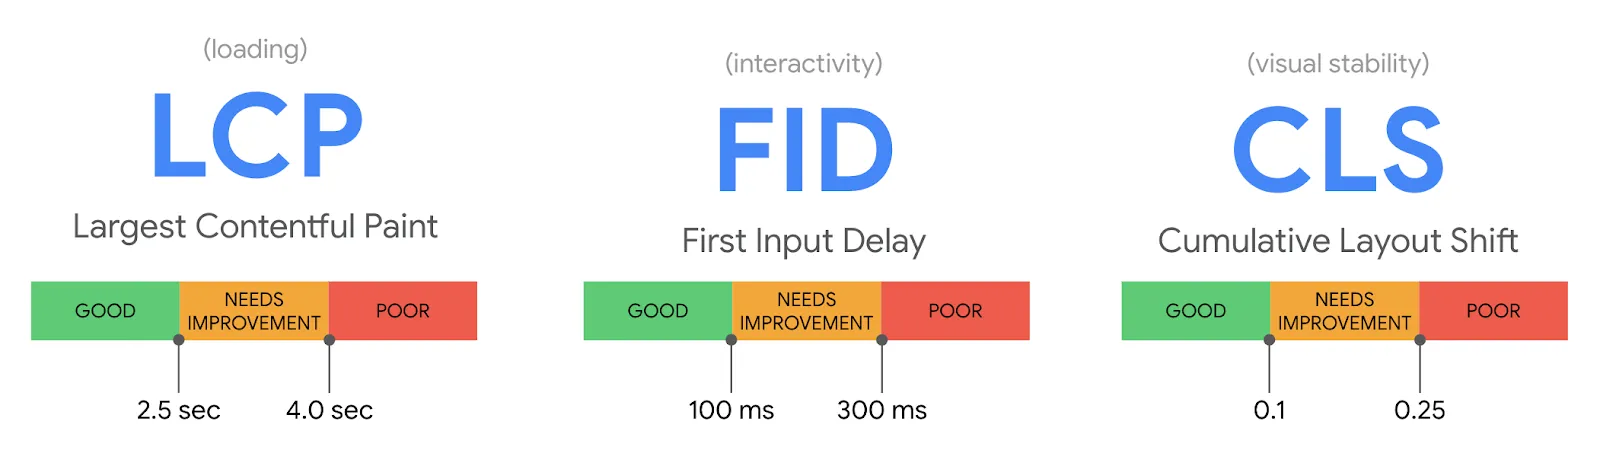
Largest Contentful Paint (LCP)
First Input Delay (FID)
Cumulative Layout Shift (CLS)
Largest Contentful Paint
The Largest Contentful Paint evaluates the loading performance, and we are not talking about measuring the speed of the page, but the perceived speed of the page, i.e., what LCP is measuring is when the user thinks the page is loaded. Therefore, it is measuring how fast users view the content.
Factors influencing this event:
- Server response
- Loading of the different web resources (JavaScript, CSS, images…)
To provide a good user experience, LCP should occur within 2.5 seconds after the first time the page starts loading, or a maximum of 4 seconds to avoid a “bad” score (although between 2.5 and 4 seconds still “needs improvement”).
First Input Delay
First Input Delay (FID) evaluates the responsiveness of the page, i.e. the time it takes for a page to react to the user’s first action, and when we say first action, it refers to any action you make on the web, whether it is clicking or pressing a key. Therefore, as you can imagine, this metric cannot be measured with a tool, but must collect information from the actual user interaction.
When we do a test to measure Core Web Vitals, this metric cannot be obtained in a real way, so it is measured through the Blocking Time (TBT), which is the period between the first content appearing and the page responding, and although this metric is somehow correlated with the FID, it is not real.
It is important to note that delays in page response occur mainly while the page is still loading, and when some of the content is visible but not interactive because the browser is busy loading the rest of the page.
The main factor influencing the First Input Delay metric is:
- The use of Javascript
To provide a good user experience, pages should have an FID of less than 100 milliseconds or a maximum of 300 milliseconds to avoid a “poor” score (although between 100 and 300 milliseconds still “needs improvement”).
Cumulative Layout Shift
Cumulative Layout Shift (CLS) is the metric that evaluates the visual stability of a page.
Ultimately, what this metric evaluates is how long the content keeps moving despite the page appearing to be fully loaded.
The CLS score is calculated by multiplying the share of the screen that changed unexpectedly on load by the distance it travelled.
Factors affecting the Cumulative Layout Shift metric are:
- Image and video size attributes.
- Insertion of new content above the already loaded area.
As you can see, this attribute is the easiest to optimise, as you only need to indicate the size attribute on the elements, so that it does not have the effect of rescaling the website as the page loads.
To provide a good user experience, pages should maintain a CLS of less than 0.1 or a minimum of 0.25 to avoid a “poor” score (although between 0.1 and 0.25 still “needs improvement”).
How we measure Core Web Vitals
Measuring Core Web Vitals can be done through two types of tools:
- Field tools: They provide the data coming from user behavior. This measurement is called RUM (Real User Monitoring) and collects data through users interacting with the web.
- Laboratory tools: In this case, the tool extracts data from a closed environment that simulates the possible action of the user.
Tools to measure Core Web Vitals
Here are some tools that will allow us to measure Core Web Vitals, either through lab data or user data.
- Google PageSpeed Insights
- Google Search Console
- Chrome UX Report (CrUX)
- Google Lighthouse
- Chrome DevTools
- Web.dev
- WebPageTest
- GTmetrix
- TREO Site Speed
- Dunplab Web Vitals Tester
- Web Vitals (Chrome Extension)
- Core SERP Vitals (Chrome Extension)
- Core Web Vitals Annotations (Chrome Extension)
- CLS Visualizer (Chrome Extension)
- Cumulative Layout Shift Debugger
- Layout Shift GIF Generator
- Semrush Site Audit
- PageSpeed Compare
- ContentKing
- DebugBear
- OnlineOrNot
- Web-Vitals Javascript Library
- Script de medición con Google Spreadsheet
In the end you should keep in mind that the ideal is to use field tools, as they give us information from real users, and in the end this is what Google uses in its algorithm.
It is also important to note that through Google Search Console we will get a more global view of the metrics, but if we want to have detailed information on a specific page, the ideal is to use extensions such as Chrome Devtools or Lighthouse Chrome Extension, as these focus only on the page that we indicate.
Regarding the option of automatically measuring the Core Web Vitals through the Google spreadsheet, you have to take into account that it will allow us to see the evolution, as it will calculate the metrics of the page day by day.
How the spreadsheet works is simple:
- Make a copy of the spreadsheet that will measure the Core Web Vitals.
- In the first tab, enter the url you want to measure and enter the name of the corresponding sheet, where the data will be stored.
- Click on Track Web Vitals and authorise the sheet.
From now on, the system, through a cron, will automatically connect to the Google PageSpeed API, and will retrieve the Core Web Vitals of each specified url, and store the data in the corresponding sheet.
If you want to have the App Script and make your modifications, you can access the Github and download it.
If you want to know more about how the Google Search Console report on Core Web Vitals works, you can access this Google article.
Weight of each Core Web Vitals metric
Through the Lighthouse tool, we can know the weighting of each of the metrics, as you can see in the latest version of Lighthouse 6.0.
By the way, it is important to note that Google is evolving the weighting of these metrics, as you can see in the following table that corresponds to version 5 of Lighthouse.
How to audit the Core Web Vitals of a website using Screaming Frog
This method is very similar to the use of the spreadsheet that we have used before, but this time, we are going to use Screaming Frog, and this has a great advantage, compared to the previous option, and it is that we will be able to have the values at the same time that we pass the crawler through our website, so we can have the Core Web Vitals values of all the URLs of our website.
To start the audit, you will need three things:
- A paid version of Screaming Frog.
- A PageSpeed Insights API key.
- The domain of the website you are auditing.
Once we have these items, we start the audit process with the following steps:
Step 1: Connect the PageSpeed Insights API key with Screaming Frog.
The first thing we need to do is to connect the PageSpeed Insights API key to Screaming Frog. This will allow us to access PageSpeed Insights data and recommendations on a page-by-page basis. Just keep in mind that we will have a limited number of PageSpeed Insights queries, which is around 25,000 per day, which should be enough for normal sites, but for larger sites, we can use this data and replicate it on the rest of the pages.
- Open Screaming Frog and go to Settings > API Access > PageSpeed Insights.
- Paste the API key in the “Secret Key” box.
- Click “Connect”.
Once logged in, click on “Metrics”, to define the metrics that will be displayed with the crawl.
For the audit, it is ideal to select “All Metric Groups”, but you can choose only the ones you want to take into account and OK.
The available metric groups are as follows:
- Overview: Provides general information for the page, such as page size and potential load savings that could be made on the page.
- CrUX Metrics: Data from Chrome’s user experience report.
- Lighthouse Metrics: Most of the lab data we use within the audit comes from here, including LCP, TBT and CLS scores.
- Opportunities: provides suggestions for page speed improvements specific to each page.
- Diagnostics: provides additional information on the overall performance of the website being tracked.
The Metrics tab within the menu on the Speed Information page of the Screaming Frog.
Step 2: Crawling and extracting website data
Now all you have to do is enter the domain, launch it and you will see that as Screamingfrog crawls the page, the Crawl and API bar will advance until it reaches 100%.
Once the whole process is finished, we must show in the top navigation bar the PageSpeed options and then export the data, so we can determine the percentage of pages that do not meet the minimum conditions.
To do this, we will filter the following fields:
- Largest Contentful Paint (LCP) (ms) - Filter to find all pages with LCP of 4000ms or more.
- First Input Delay (FID) (ms) - Filter to find all pages with TBT of 300ms or more.
- Cumulative Layout Shift (CLS) - Filter to find all pages with CLS of 0.25 or more.
Add this data to a separate datasheet so you can easily see which pages are failing on each metric. Next, I recommend reporting on the percentage of pages on the site that don’t meet each Core Web Vitals minimum threshold, something like this:
- 89% of pages have Largest Contentful Paint (LCP) metric over 4 seconds (failure) - look at the “LCP >4s” tab in the attached datasheet.
- 18% of pages have a total block time of more than 300 milliseconds (failure) - see the “TBT > 300 ms” tab in the attached datasheet.
- 93% of pages have a Cumulative Layout Shift (CLS) score of more than 0.25 (failure) - see the “CLS > 0.25” tab in the attached datasheet.
Step 3: Detection of page-specific problems and recommended actions to solve them.
Now we need to determine what to do in each case, and here the Pagespeed Insights API will help us.
In the right column of Screamingfrog, under the Overview tab, scroll down until you find “PageSpeed”.
In this section you will find the list of problems/recommendations related to page speed and, for the most part, to the Core Web Vitals.
As you will see, here you will find many points to solve, remember that we have previously indicated that all the metrics should be shown to us.
If there is any point that you do not know what it means, the ideal is to use the Google Web.dev website to get more information about it.
At this point, what you should do is select the problem in question and you will see the affected pages, so you only have to export them to save them in an excel sheet to solve the problem in question.
Step 4: Review the changes
Once each of the points we have detected have been solved, we must run Screaming Frog again, with the same configuration as above, and see what percentage of pages have improved with respect to our performance.
Main problems affecting Core Web Vitals
Through a post by Brian Dean in Backlinko we can see some statistical data, after analyzing 208,085 web pages, and then I will detail a brief summary of the data provided by Brian.
- 53.77% of the sites had a good Largest Contentful Paint (LCP) score. 46.23% of the sites had “poor” LCP scores or “in need of some form of improvement.
- 53.85% of the websites in the dataset had optimal First Input Delay (FID) ratings. Only 8.57% of the sites had a “poor” FID score.
- 65.13% of the sites analysed had good Cumulative Layout Shift (CLS) scores.
In terms of the main problems found on the sites, we found:
Main problems in the Largest Contentful Paint metric:
- High levels of requests and large transfer sizes (100% of pages)
- High load on data transfer (100% of pages)
- Critical request strings (98.9% of pages)
- High initial server response time (57.4% of pages)
- Images not served in next generation format (44.6% of pages)
Major issues with the First Input Delay metric:
- Inefficient cache policy (87.4% of pages)
- Long main thread tasks (78.4% of pages)
- JavaScript not used (54.1% of pages)
- CSS not used (38.7% of pages)
- Excessive document object model size (22.3% of pages)
- It was interesting to see that caching issues tended to negatively affect FID more than any other issue. And, not surprisingly, poorly optimised code (in the form of unused JS and CSS) was behind many high FID scores.
Key issues with the Cumulative Layout Shift (CLS) metric
This metric specifically looks at how the content of a page “shifts”. Anything below .1 is rated as “good” in Search Console.
The most common issues affecting the CLS of projects included:
- Major design changes (94.5% of pages)
- Resources blocking rendering (86.3% of pages)
- Hidden text during font loading (82.6% of pages)
- Non-existent preloading in requests (26.7% of pages)
- Images of inappropriate size (24.7% of pages)
It is important to note that these data are extracted from a sample of almost 210,000 web pages, so we cannot extrapolate the data in a general way to all websites.
Recommendations for improving Core Web Vitals scores
Now that we have an audit of the Core Web Vitals, and we have in each of the points that can affect each of the metrics, the ideal is that we start working on each of the problems that affect the factors, for this, we believe that the best thing we can do is to provide you with the three web pages that Google has created for each of the metrics, and that explain what to do to improve each of the sections.
- Optimizar Largest Contentful Paint (LCP)
- Optimizar First Input Delay (FID)
- Optimizar Cumulative Layout Shift (CLS)
Frequently Asked Questions about Core Web Vitals
Can websites have a visual indicator in the SERPs that indicates Core Web Vitals?
Google has already used a symbol to report pages developed in AMP format, and now it seems that they are also testing a round icon with a star, which would indicate that the pages are fast and have a good user experience.
Regarding whether or not this indicator will have an impact on the CTR of the snippet, I doubt very much that this format will represent a major change, so from my point of view, I don’t think it will be a relevant factor in this aspect.
Will Core Web Vitals apply to Mobile and Desktop?
Although we can obtain Core Web Vitals metrics for both Mobile and Desktop, Google has indicated that only data obtained from Core Web Vitals on mobile devices will be used as ranking signals.
How will Core Web Vitals affect our rankings?
Although much has been said about this topic, Core Web Vitals are not going to be a metric that will make the rankings of our pages evolve much, since, as Google has explained, these signals will be introduced into the algorithm, but they will only be used, at least in this phase, as a tie-breaker between two pages that have quality and relevant content for the search. Therefore, although it is an issue you should be concerned about, don’t do it because it is a ranking factor, but because it is a user experience factor.
If a low Core Web Vitals score affects SEO, will it affect the page or website level?
A priori there is no confirmation, but it is assumed by different comments made by people from Google’s search team, that it will affect at page level.
Can Core Web Vitals vary?
It is not that they may vary, but that they do vary. As of today, Google has already notified at least twice of the change in the weighting of the Core Web Vitals, so it is to be expected that both the metrics and the weighting of each one of them will vary over time.
It is important to note that this weighting that we comment is related to Lighthouse and not to the algorithm, but we believe that it may have some correlation.
If you wish, you can see in the Web Vital Changelogs the evolution of the Core Web Vitals.
My opinion about Core Web Vitals
For me, the Core Web Vitals are vital, never better said, but not from an SEO point of view, but from a user experience point of view.
I say not from an SEO point of view, because I don’t think that the Core Web Vitals will give an important boost to the websites that have these metrics well, although I do think that the websites that have a bad score within the metrics will be affected and in a negative way, but for the websites that have a good score, I don’t think they will have an important push in terms of SEO positioning, although it is true that if these websites with low scores lose value, someone will have to pick up these positions.
For me, it will be like when Google launched its Mobile update, in the end it mainly affected the websites that were not optimised, but the websites that had done well, did not have a significant positive effect on their positioning.
Regarding the good part of the Core Web Vitals, I have to say that in the end Google is going to make the websites much better, as people are going to start working to improve these metrics, and improving the metrics will improve the user experience on the websites considerably, so one way or another, this update will allow the websites to be better, thus achieving a better user experience. macos/deepLFree.translatedWithDeepL.text